Life of drawing
Drawing Effecter Tool on Rhino 3DFall 2024
@Scripting and Parametric Design, 48-724, Carnegie Mellon University
Implementation tool: Grasshopper, GH Python
Source code
Instructor: Jimmy Cheng
Drawing mode
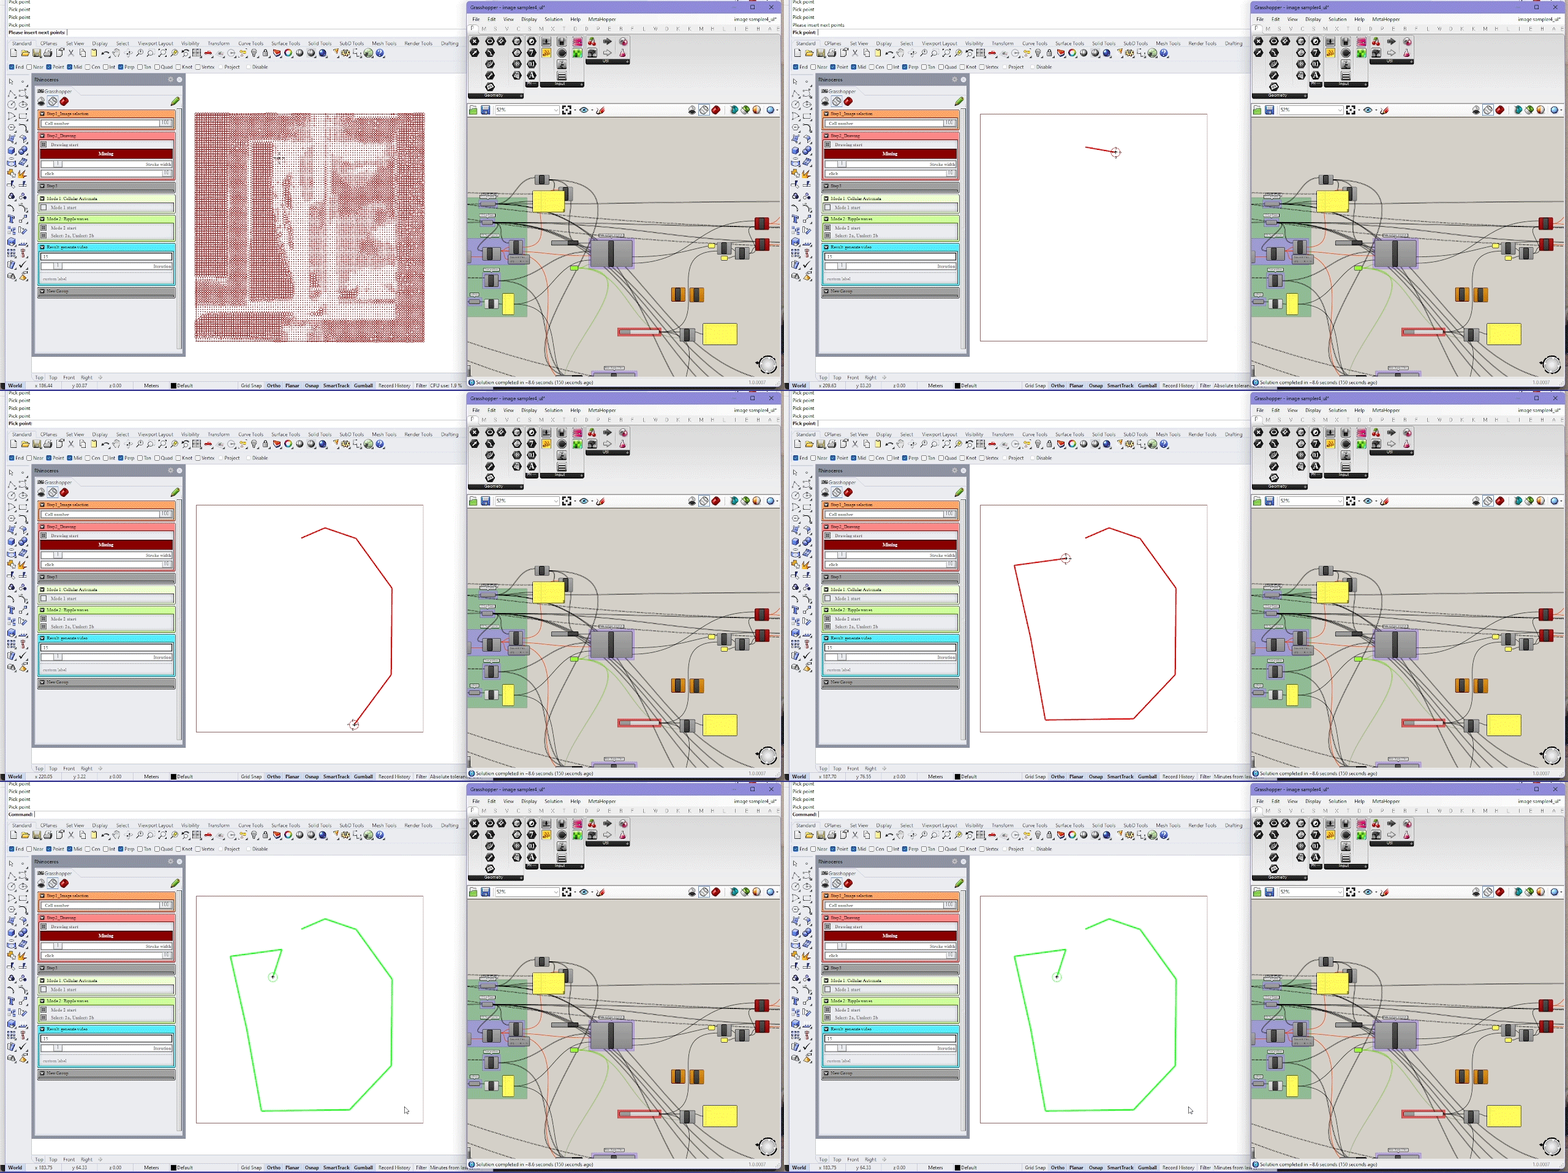
The starting point of this project was when I complained about the existing limitations in Rhinoceros and Grasshopper. Jimmy suggested that I make a drawing tool with a cellular automata effect, as an extension of my previous work with Sherry, One-man drawing game, Exquisite Corpse. It was an intriguing idea, especially the part where users can directly input the position of live cells. While using Image Sampler, the default point group on the image is dead, the closest point group near the user’s new drawing line is alive.
Goal: To work within the Rhinoceros and Grasshopper environment and learn how to adapt to this program through explorative practices. I usually use Rhinoceros 3D with accustomed tools, but by pushing my boundaries, I aim for this project to broaden my perspective and enhance my flexibility.
Goal: To work within the Rhinoceros and Grasshopper environment and learn how to adapt to this program through explorative practices. I usually use Rhinoceros 3D with accustomed tools, but by pushing my boundaries, I aim for this project to broaden my perspective and enhance my flexibility.
A basic workflow
- Use the image sampler to map point coordinates, colors, and polygons based on 1D list data.
-
The default image sampler point group is considered Dead, while the closest point group near the user’s new drawing line is designated as Alive.
- Distinctive differences (e.g., color, style, shape, size) will distinguish "dead" and "alive" groups.
- Introduce additional modes beyond Cellular Automata, such as Ripple effects.
- Gather parameters and integrate them into the Remote Control Panel.
Life of drawing - Cellular Automata mode![]()
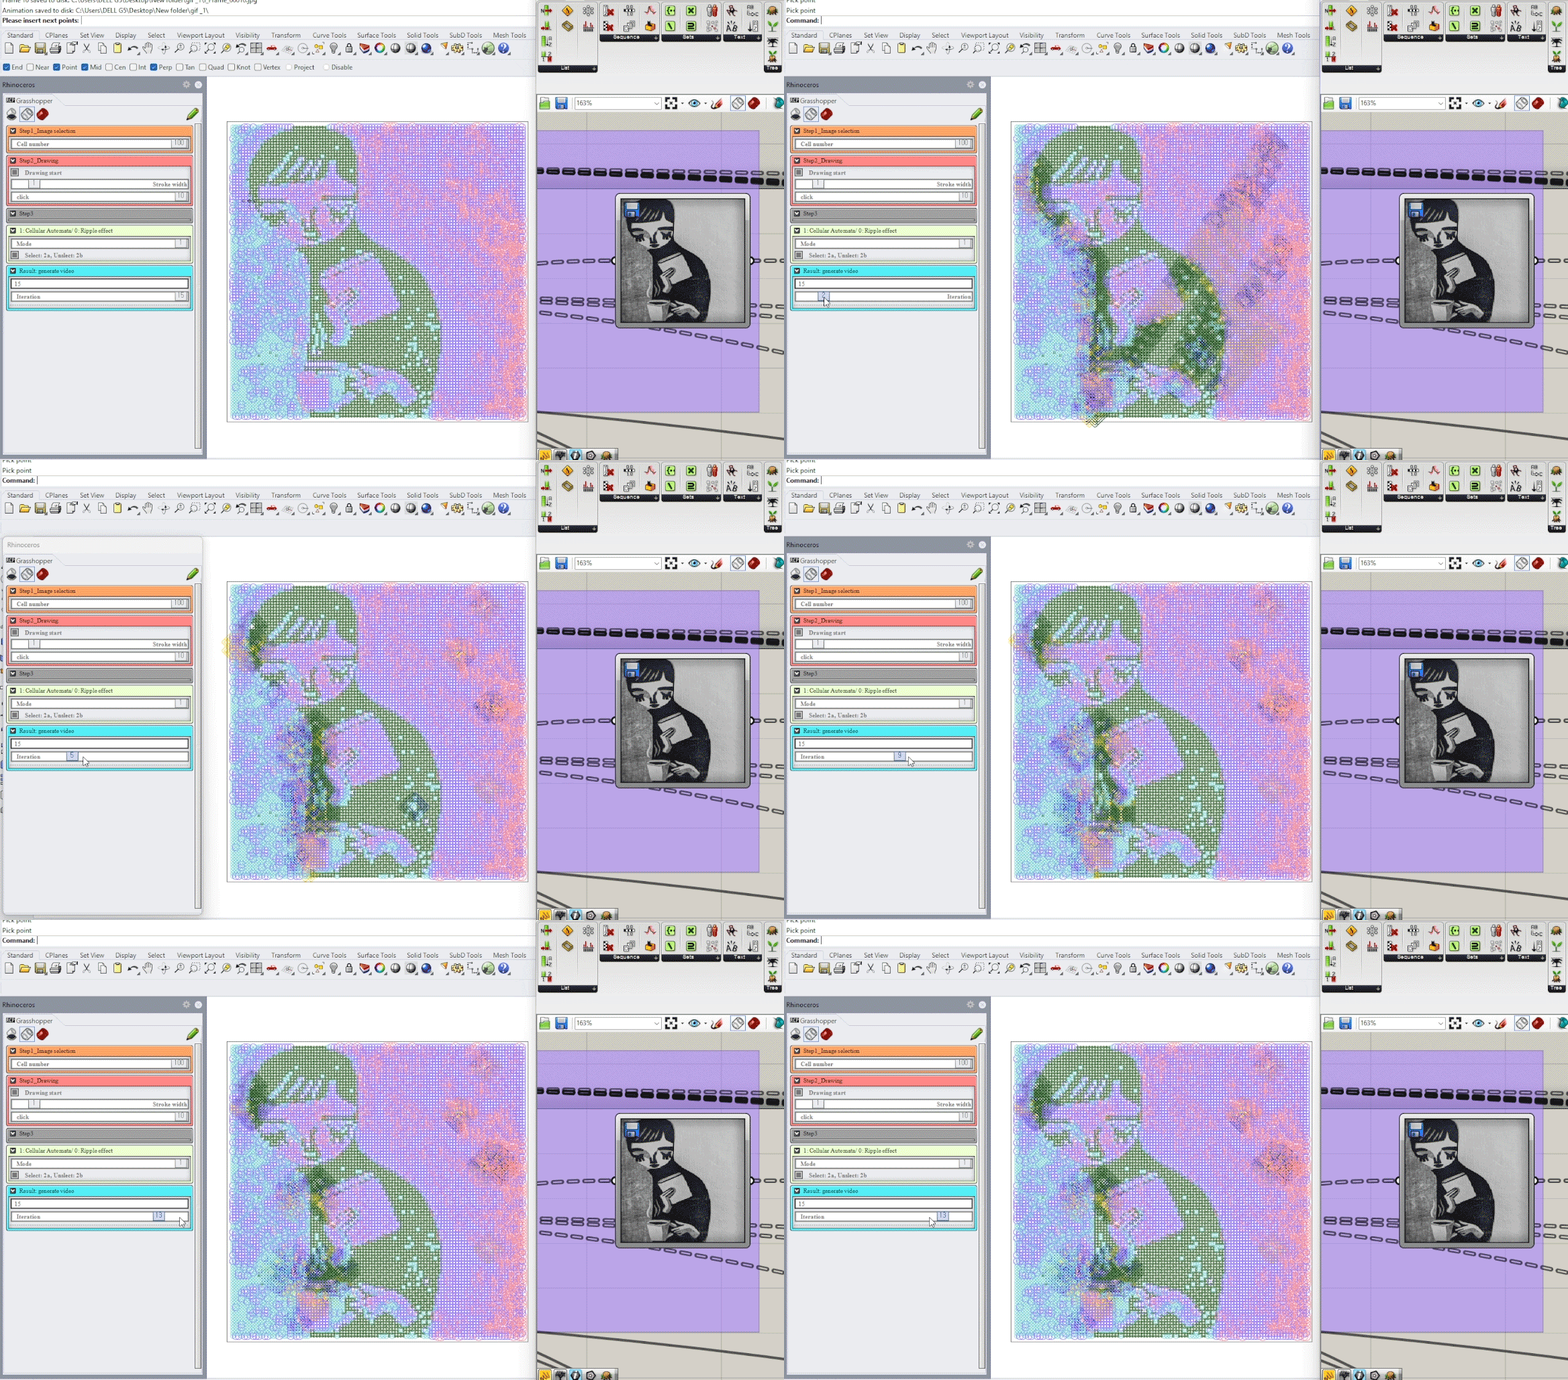
How does Mode 0: Cellular Automata work?
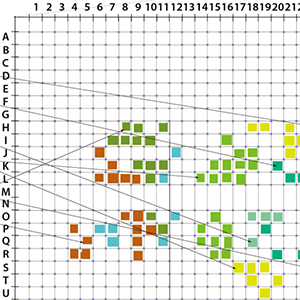
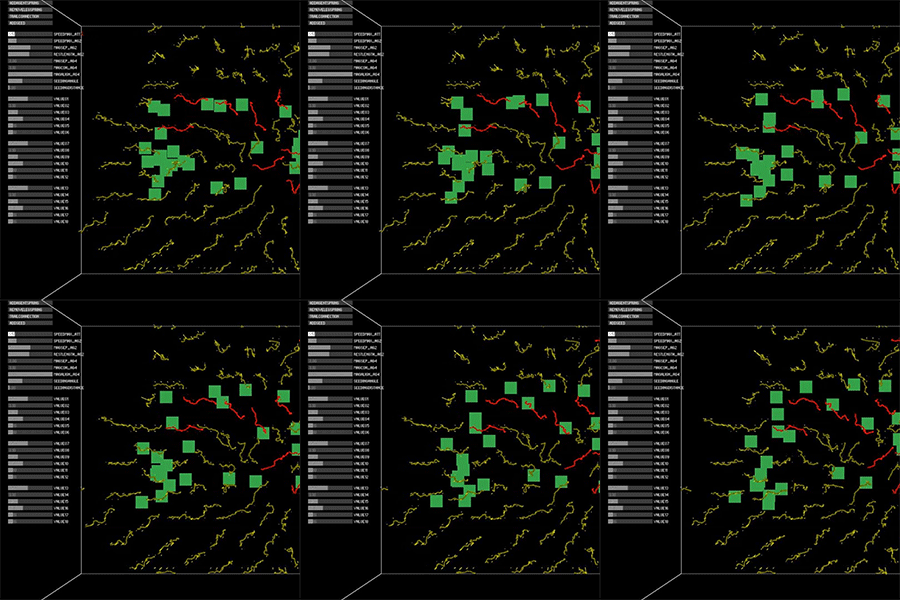
When the number of rows and columns is reduced to 36, it becomes easier to distinguish between the live and dead cells. The dead cells are mapped using color and circle radius based on the intensity of the original colors in the uploaded image. Initially, I intended to use RGB colors directly, but since GH Python doesn’t handle RGB data flexibly, I opted to work with the intensity values, dividing the colors into four groups. I think this simplified approach works well.
The live cells for each phase will change shape into a curvy diamond. The color change corresponds to the cell locations; for example, purple → yellow, green → green, pink → blue, and cyan → black.
I experimented with hatch and surface options to make the cells more distinct, but this proved to be very time-consuming. As a result, I decided to use layered polygons to mark them.
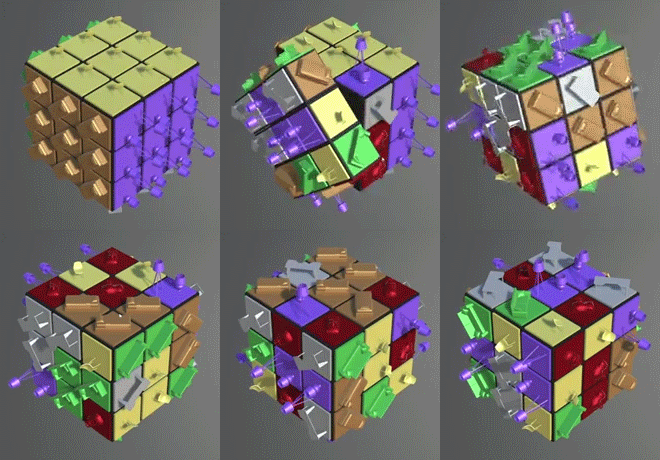
In the actual demonstration (Cell size 100), the dead cells, represented by circles, became dense and effectively visualized the uploaded image. The movement of the live cells was subtle yet clearly observable. I appreciate how the cellular automata effect emerges gently, with bright or darker colors, to present the game of drawing life, as if a city seen from the satellite.
Mode 0: Cellular Automata, with cell size 36
Life of drawing - Ripple mode A
![]()
Life of drawing - Ripple mode B![]()
4-2. How does Mode 1a & 1b: Ripple Effect work?
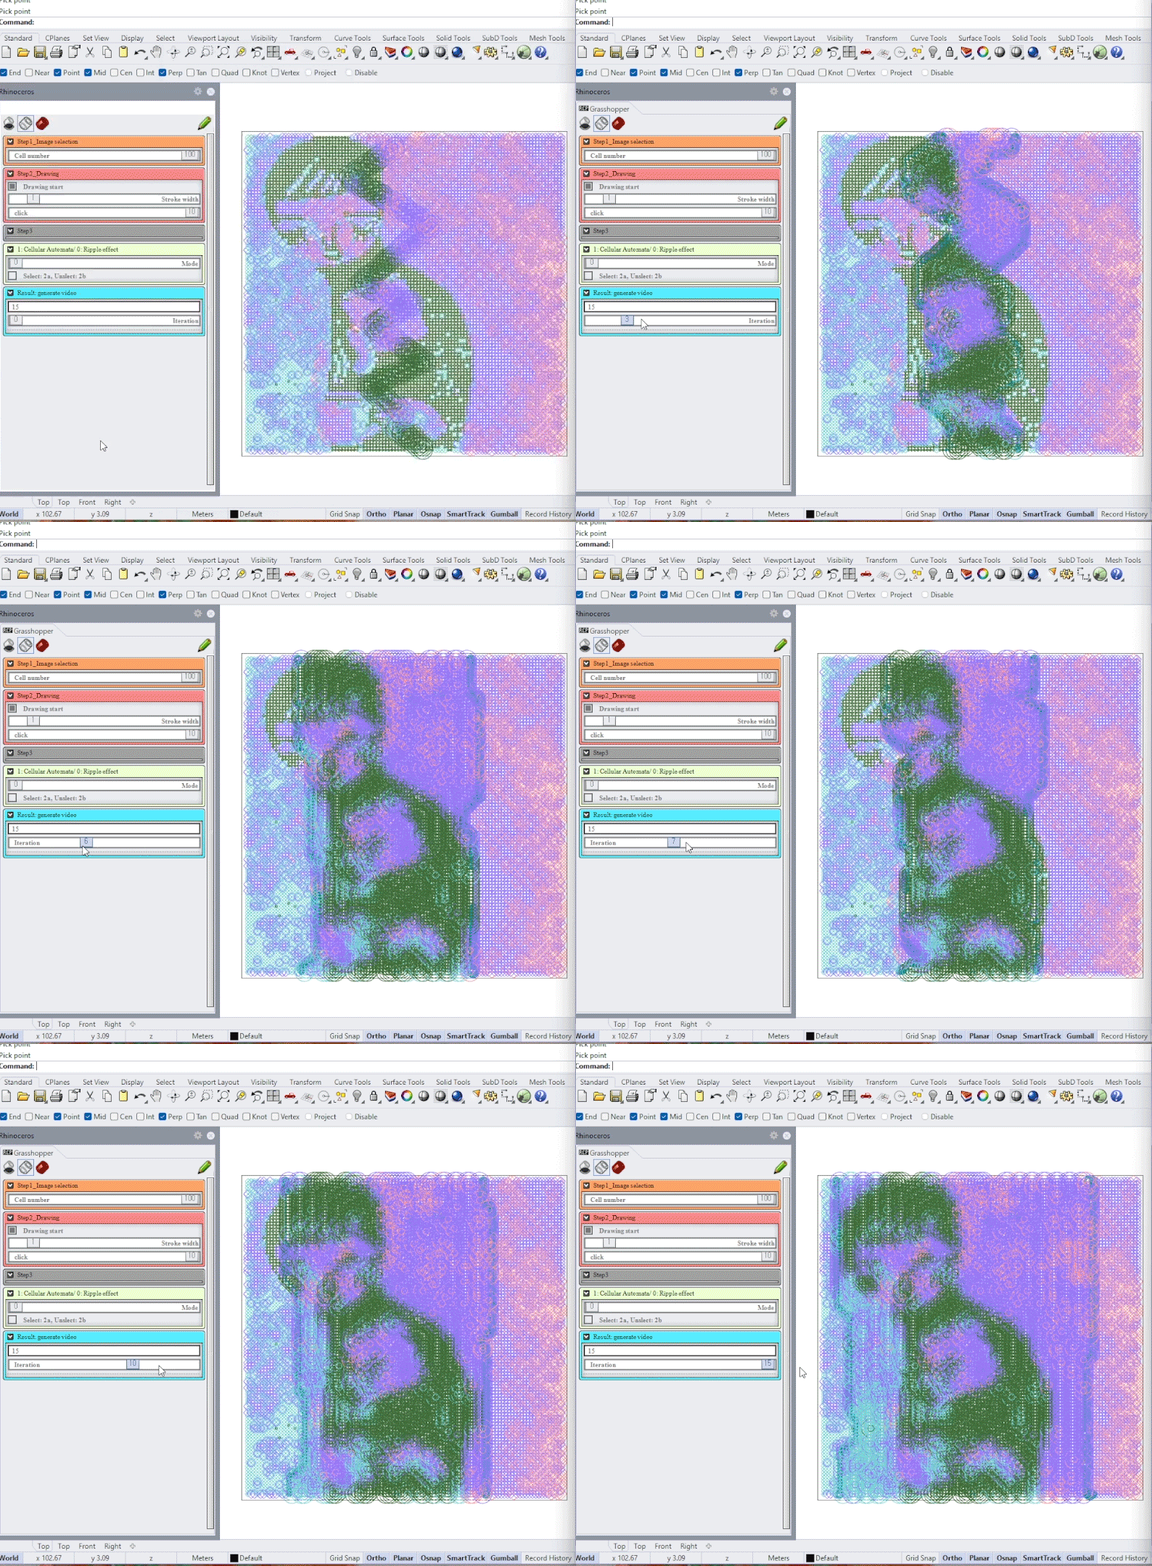
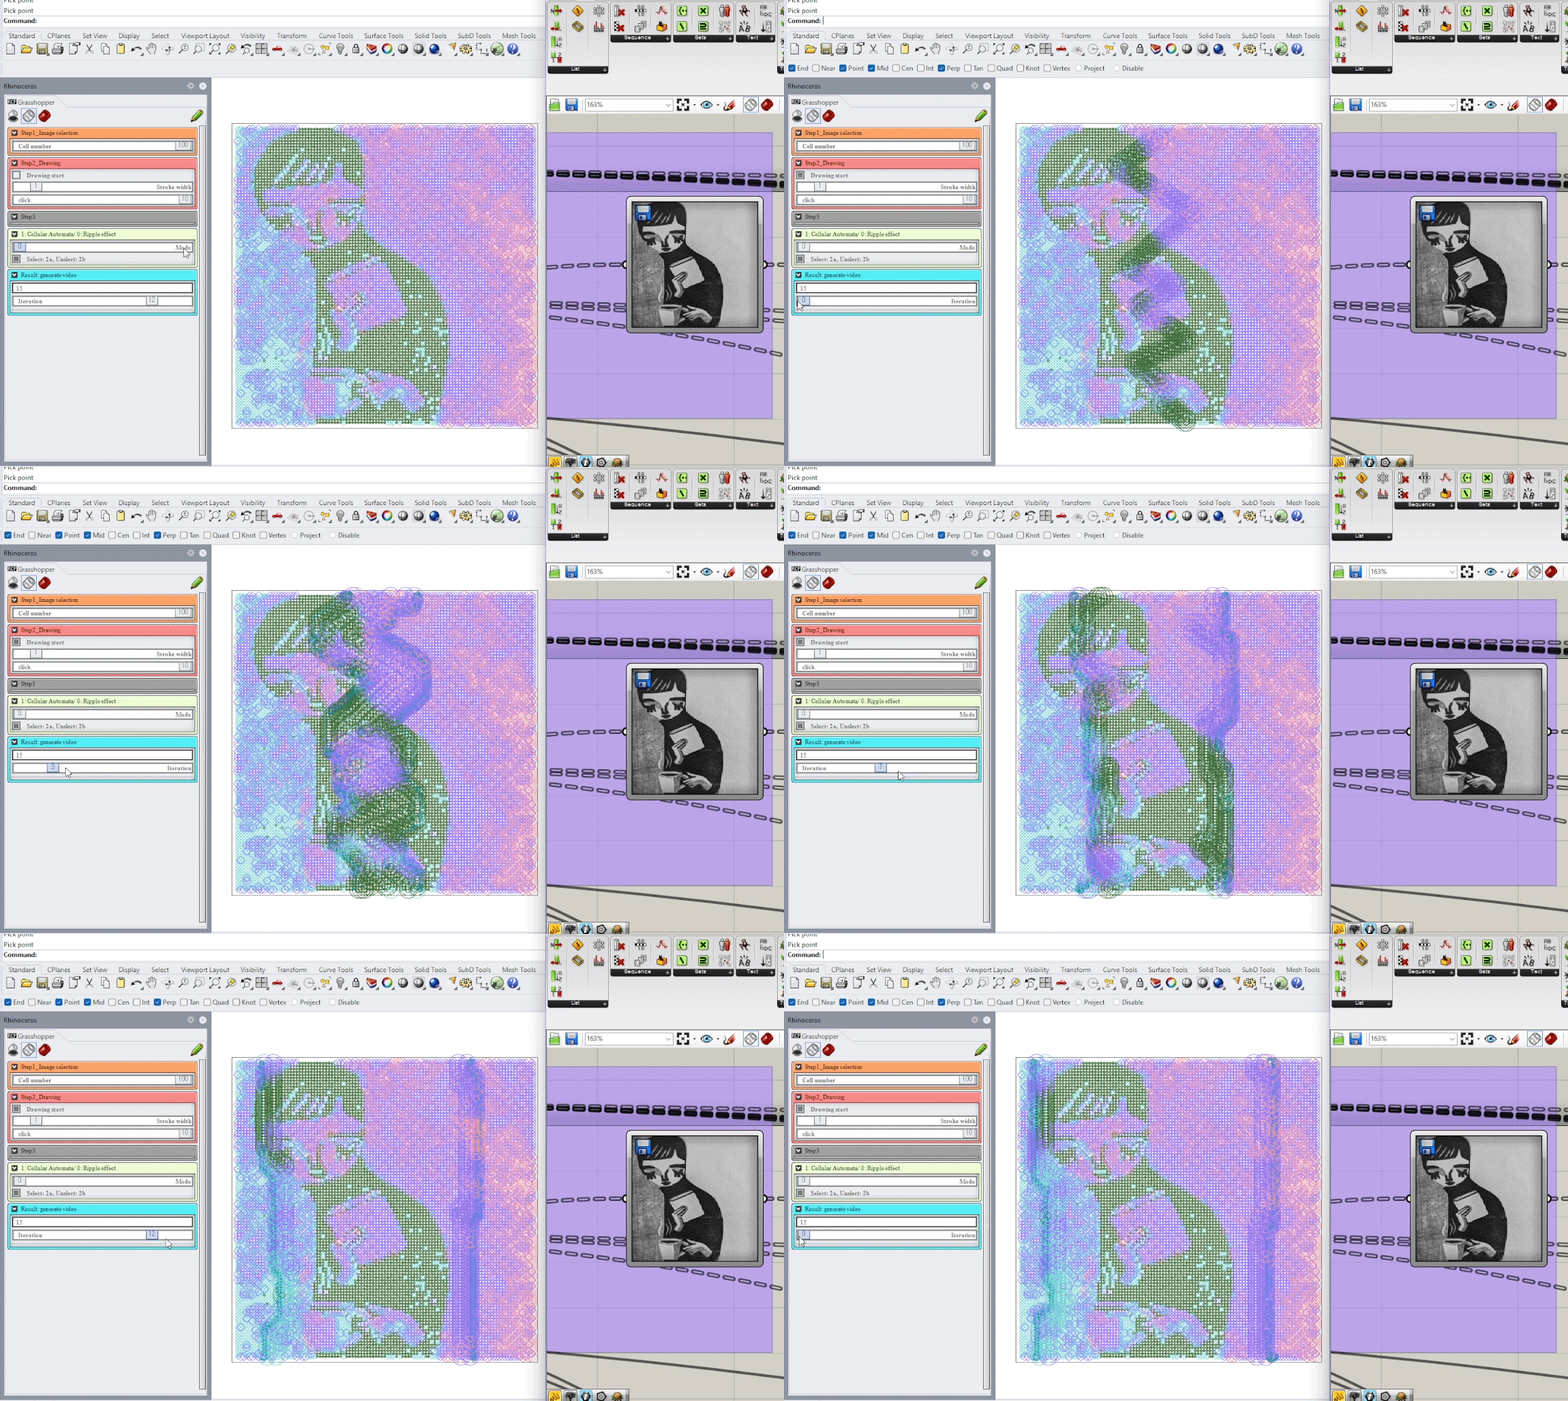
This ripple effect, A and B, is imparted after the cellular automata, as I thought it would be nicer to have more than one option. Somehow, the Game of Life doesn’t seem to have a crazy effect on me, so I developed two types of ripple effects based on the Python code for the Game of Life. If a neighbor progresses to the live phase, the next phase will either be dead or transformed into an intermediate state. In these modes, I didn’t change the color of the active state, as I found the shape conversion created a beautiful blurred effect.
Ripple Effect A presents a rippling visual effect that spreads to the edge, with intermediate and live cells alternating in appearance. The outline of the ripple is turquoise.
Ripple Effect B focuses on the outline of the ripple effect. Once the live cell transitions through an intermediate state, it returns to the dead state.
Mode 1a: Ripple Effect a, with cell size 36
Mode 1b: Ripple Effect b, with cell size 36
